|
|
Home > Problems > Chapter 5
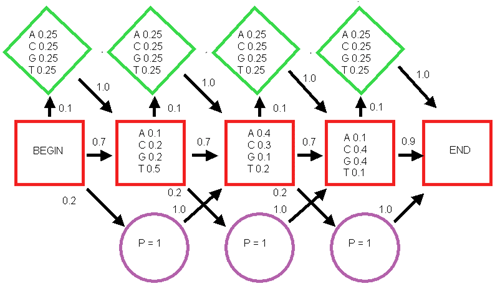
6. A simplified hidden Markov Model (HMM) is shown below. (Red square, match state; green diamond, insert state; blue circle, delete state—probability of 1; arrows, probability of going from one state to the next.)

- Calculate the probability of the sequence TAG by following a path through the model starting at Begin, going through each of the three match states (red squares), and ending at End.
- Repeat step a for a path that, starting at Begin, goes first to the first insert state (green diamond), then to a match state (red square), then to a delete state (blue circle, probability 1 for any character in this state), then to a match state, and finishes at End.
- Which of the two paths is the more probable one, and what is the ratio of the probability of the higher to the lower one? The highest-scoring path is the best alignment of the sequence with the model.
- To improve the model, we keep adjusting the scores for the states and transition probabilities by aligning additional sequences with the model using an HMM adaptation of the expectation maximization algorithm. In the expectation step, we calculate all of the possible paths through the model, sum the scores, and then calculate the probability of each path. Each state and transition probability is then updated by the maximization step of the algorithm to make the model better predict the new sequence.
For this example, suppose that the model has been made from 30 sequences, and that the alignment of TAG in step a has a probability of 1.0; i.e., this path is overwhelmingly the best of all possible paths through the model. What would be the new fractions in the first match state? (Note that only a fraction of the sequences originally passed through the first state�think carefully about how many actually did.) Similarly, what would be the new values for the transition probabilities from Begin to this first match state, assuming that 0.7 of the 30 sequences followed the path from Begin to the first match state? (Hint: Updating the match state frequencies should be done by going back to the raw base numbers in each column. Similarly, updating the transition probability should be done by counting the number of sequences that would have followed the path from Begin to the first match state.)
- Change all the values in each of the states to log odds scores, assuming that the frequency of each base is 0.25. Also change the transition probabilities to log odds, i.e., log to base 2 of the ratio of observed transition probability to background probability. (Note: Transition background is an equal probability of making a transition to each subsequent state and will be calculated by dividing 1 by the number of possible transitions from each state; i.e., the background probability will be one of 1/2 = 0.5, 1/3 = 0.33, or 1/1.) Now calculate the probability in step a as a log odds score.
|
|
|
| © 2004 by Cold Spring Harbor Laboratory Press. All rights reserved. |
 |
| No part of these pages, either text or image, may be used for any purpose other than personal use. Therefore, reproduction, modification, storage in a retrieval system, or retransmission, in any form or by any means, electronic, mechanical, or otherwise, for reasons other than personal use, is strictly prohibited without prior written permission. |
|
|
|