|
|
Home > Problems > Chapter 5
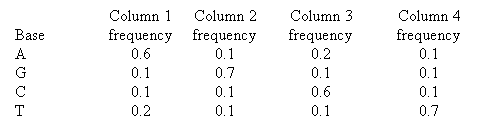
3. When a global msa can be made, one can pick out the most conserved regions (motifs), make a scoring matrix, and search for other sequences that have this same motif. The matrix will take into account the variation found in the sequences. We will make a position-specific scoring matrix (PSSM, also called a scoring matrix, or weight matrix) by hand corresponding to a short msa and then use the matrix to scan a sequence. Here is a table showing the frequency of each base in an alignment that is four bases long:
- Assuming that the background frequency is 0.25 for each base, calculate a log odds score for each table position; i.e., log to the base 2 of the ratio of each observed value to the expected frequency.
- Align the matrix with each position in the sequence TGAGCTAA starting at position 1, 2, etc., and calculate the log odds score for the matrix to match that position.
- Now convert the alignment scores to ODDS scores, sum them, and calculate the probability of the best matching position.
|
|
|
| © 2004 by Cold Spring Harbor Laboratory Press. All rights reserved. |
 |
| No part of these pages, either text or image, may be used for any purpose other than personal use. Therefore, reproduction, modification, storage in a retrieval system, or retransmission, in any form or by any means, electronic, mechanical, or otherwise, for reasons other than personal use, is strictly prohibited without prior written permission. |
|
|
|
